Class 9 Maths Statistics Worksheet — Free Printable PDF
Download a free Class 9 Maths worksheet on Statistics with MCQs, fill in the blanks and short answer questions. Complete answer key included. Personalized to your class, subject and chapter.
⭐ MeritMate — Class 9 Maths: Statistics
Curriculum-Aware · meritmate.inSection A: Multiple Choice Questions
Q1. The mean of the first 10 natural numbers is:
a) 5
b) 5.5
c) 6
d) 4.5
Q2. Which of the following is not a measure of central tendency?
a) Mean
b) Median
c) Mode
d) Range
Q3. The class mark of the class interval 20-30 is:
a) 20
b) 30
c) 25
d) 10
Q4. The median of the data 3, 7, 5, 11, 9 arranged in ascending order is:
a) 5
b) 7
c) 9
d) 11
Q5. A frequency distribution table is used to represent:
a) Only ungrouped data
b) Only grouped data
c) Both grouped and ungrouped data
d) None of the above
Section B: Fill in the Blanks
Q6. The difference between the maximum and minimum values of a data set is called ________.
Q7. The observation that occurs most frequently in a data set is called the ________.
Q8. The mean of first 5 even natural numbers is ________.
Q9. A graphical representation of grouped data using rectangles is called a ________.
Q10. The sum of all frequencies in a frequency distribution table is equal to ________.
Section C: Short Answer Questions
Q11. Find the mean of the following data: 15, 22, 18, 30, 25, 10, 20.
Q12. The marks scored by 8 students are 45, 60, 55, 70, 40, 65, 50, 75. Find the median of the data.
Q13. Find the mode of the following data: 12, 15, 12, 18, 20, 15, 12, 25, 18, 12.
Q14. The mean of 6 observations is 14. If five of the observations are 10, 12, 18, 16, and 11, find the sixth observation.
Q15. Construct a frequency distribution table for the following data using class intervals of width 10, starting from 10: 15, 23, 35, 12, 28, 42, 19, 37, 25, 41, 13, 30.
⭐ Answer Key
Class 9 · Maths · StatisticsAnswer Key
Q1. b) 5.5
Explanation: Sum of first 10 natural numbers = 10 x 11 / 2 = 55. Mean = 55 / 10 = 5.5
Q2. d) Range
Explanation: Mean, Median, and Mode are measures of central tendency. Range is a measure of dispersion.
Q3. c) 25
Explanation: Class mark = (Upper limit + Lower limit) / 2 = (20 + 30) / 2 = 25
Q4. b) 7
Explanation: Ascending order: 3, 5, 7, 9, 11. Number of observations = 5 (odd). Median = middle value = 3rd term = 7
Q5. c) Both grouped and ungrouped data
Explanation: A frequency distribution table can be constructed for both grouped and ungrouped data.
Q6. Range
Q7. Mode
Q8. 6
Explanation: First 5 even natural numbers are 2, 4, 6, 8, 10. Mean = 30 / 5 = 6
Q9. Histogram
Q10. Total number of observations (n)
Q11. Mean = Sum of observations / Number of observations
Sum = 15 + 22 + 18 + 30 + 25 + 10 + 20 = 140
Mean = 140 / 7 = 20
Q12. Arranging in ascending order: 40, 45, 50, 55, 60, 65, 70, 75
Number of observations = 8 (even)
Median = (4th term + 5th term) / 2 = (55 + 60) / 2 = 115 / 2 = 57.5
Q13. Arranging the data: 12, 12, 12, 12, 15, 15, 18, 18, 20, 25
The number 12 appears 4 times, which is the highest frequency.
Mode = 12
Q14. Mean of 6 observations = 14
Sum of all 6 observations = 14 x 6 = 84
Sum of 5 given observations = 10 + 12 + 18 + 16 + 11 = 67
Sixth observation = 84 - 67 = 17
Q15. Frequency Distribution Table
Class Interval - Tally Marks - Frequency
10-20 - llll - 4 (values: 15, 12, 19, 13)
20-30 - llll - 4 (values: 23, 28, 25, 30)
30-40 - ll - 2 (values: 35, 37)
40-50 - ll - 2 (values: 42, 41)
Total - - 12
More Class 9 Maths Worksheets
Want a different worksheet on Statistics?
Generate a fresh set of unique questions instantly. ✨ Generate My Free Worksheet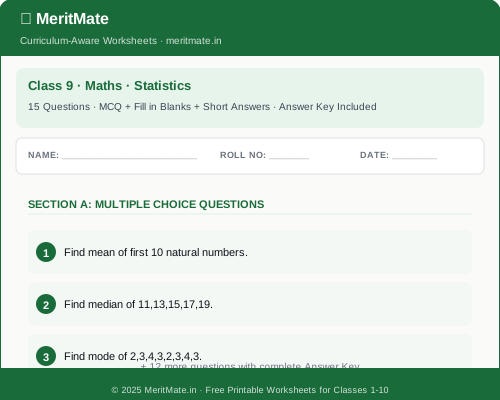
Sample preview — Download full worksheet with complete answer key